
.jpg)
Fibonacci Fan
Fibonacci fans are sets of trendlines drawn from a high or a low of the price chart through a set of points dictated by Fibonacci retracements. Just like with Fibonacci retracement, you need to choose the tool and connect a swing high and a swing low with a base line.
Then an invisible vertical line, equal to the vertical distance between the high and the low, is drawn from the second extreme point to the level of the first extreme point. Three trend lines are then drawn from the first extreme point so they pass through the invisible vertical line at the Fibonacci levels of 38.2%, 50.0%, and 61.8%.
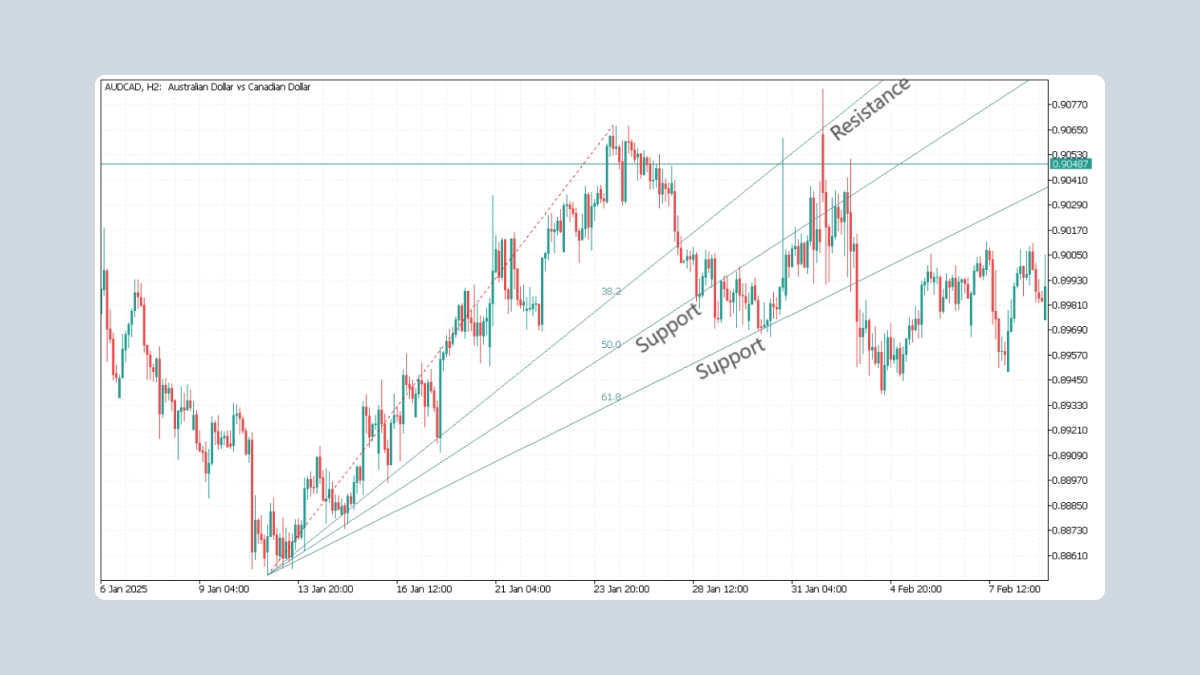
Fibonacci fan lines can act as support or resistance pinpointing areas at which the price may reverse. As soon as a correction starts, a Fibonacci fan will allow you to see the areas you should pay special attention to.
Corrections (pullbacks) to 38.2% Fibonacci are considered shallow and point to the continuation of the main trend.
A pullback to 50% is moderate and can be observed often.
A correction to the so-called “golden ratio” of 61.8% is more rare, but this level of support/resistance will be the strongest of the three.
Note that because of the properties of the fan, the further out the lines extend in time, the more sensitive they are to exact placement of the two marker points. That means a small change in placement of either of the marker points could result in large movements further out in the extension lines. The fan usually becomes less accurate the further out it extends. When the price is no longer responding to the support or resistance areas of the fan, it is disregarded (this can happen when it extends outside of the active chart area).
Sometimes technical analysts plot several Fibonacci fans using different waves of the prices. This potential reversal areas of the price to be placed with greater precision.