Fundamental Analysis
- Key drivers this week: The market will be closely watching key economic data and corporate earnings reports. Labor indicators will be released (JOLTS, ADP payrolls, nonfarm payrolls) as well as Personal Consumption Expenditures (PCE), the Fed’s preferred inflation gauge. It is also one of the busiest weeks of the Q1 earnings season: major Nasdaq tech names like Apple, Tesla, Amazon, Meta, and Nvidia are reporting, which could strongly move the index.
- COT Report (April 25): The Commitment of Traders report published Friday, April 25 (data as of April 22) shows that speculators increased their long positions in Nasdaq futures by +3,682 contracts and reduced their shorts by −1,079. This reflects a net bullish sentiment from institutional traders (speculative funds). An increase in net long contracts typically suggests a positive bias in market sentiment for the following week.
- Volume and Open Interest: Comparing Friday, April 25 to Monday, April 28, trading volume was moderate and open interest (OI) remained high, suggesting continued liquidity. Open interest hovered around ~242,000 contracts during the week of April 22 (vs. ~235,000 the week before), which signals that rising volume paired with increasing OI tends to confirm trend continuation, indicating that market participants are maintaining their positions and supporting the current direction of Nasdaq prices.
Technical Analysis
US100 | H2
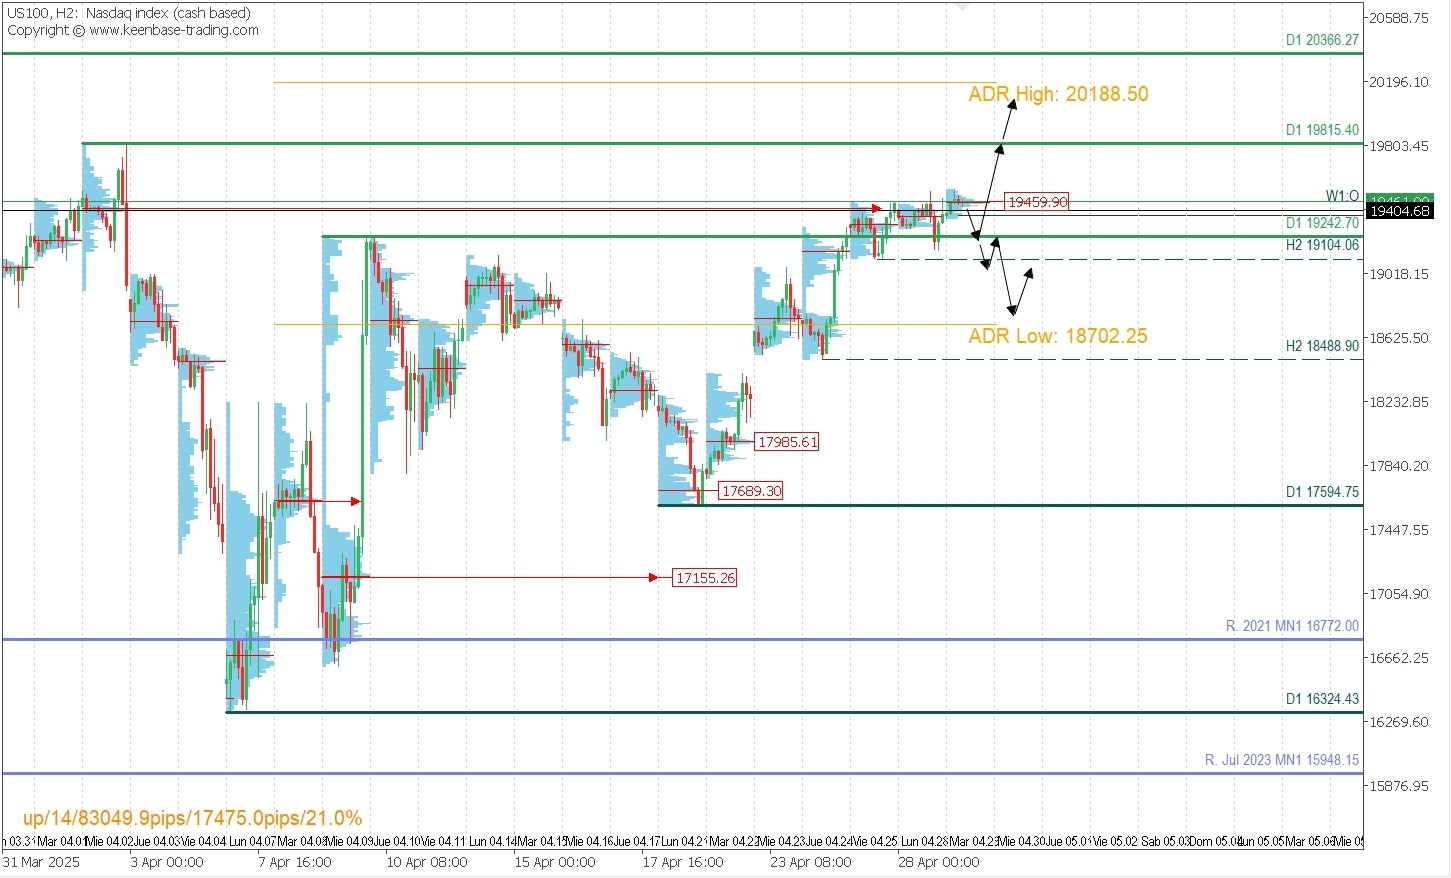
The index is consolidating around a supply zone and forming a POC (Point of Control) near 19451.68 during the early sessions, awaiting new fundamental catalysts.
With the price trading above the session POC, bulls are expected to activate early, potentially driving the price to challenge the last validated daily resistance at 19815.40. A confirmed breakout above this level would signal a bullish reversal.
Conversely, if price moves below the POC, it is expected to seek buying liquidity at 19374 or 19242.70. If bulls are confirmed in that area (via a bullish M5 PAR* signal), a new rally toward 19815 and the extended average bullish range near 20188.50 could follow.
However, if the price triggers more aggressive selling below 19240, we may see a broader retracement targeting 19112, and only after a confirmed break below that would 18800 come into play as the next demand zone.
Technical Summary
Bearish scenario: Sell below 19451, targeting 19242.70, 19114, and potentially 18800.
Bullish scenario: Buy above 19243 (with confirmed M5 PAR* setup) targeting 19815, 20000, and 20188.


