.jpg)
ใช้ Fibonacci Expansion อย่างไรดี?
เมื่อคุณกาง Fibonacci expansion คุณต้องคำนึงถึงคลื่นราคา 2 คลื่น
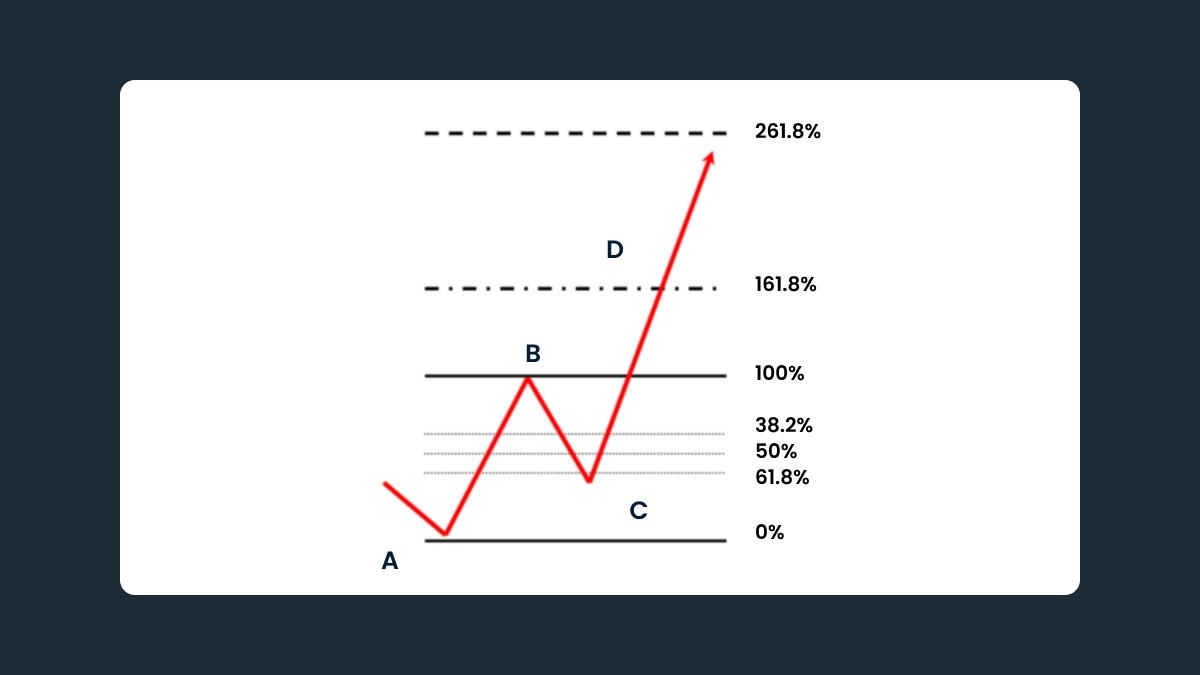
คลื่นแรก (AB) แสดงถึงการเคลื่อนไหวของราคาที่สอดคล้องกับแนวโน้มหลัก ระยะห่างระหว่างจุด A และ B จะถูกมองว่าเป็น 100% และถูกนำไปใช้ในการคำนวณเพิ่มเติม
คลื่นที่สอง (BC) คือการปรับฐานของราคาจากการเคลื่อนไหวก่อนหน้า จุดสิ้นสุดที่จุด C ถือเป็นจุดเริ่มต้นในการลากเส้นระดับการขยายตามค่าสัมประสิทธิ์ฟีโบนักชี 0.618 (61.8%) หรือ 1.618 (161.8%) นอกจากนี้ยังมีส่วนขยายเสริมที่ 2.618 และ 4.236 อีกด้วย
เครื่องมือ Fibonacci expansion ถูกนำมาใช้เพื่อหาตำแหน่งของคลื่นที่สาม (สามารถศึกษาเพิ่มเติมได้จากทฤษฎีคลื่นเอลเลียต)
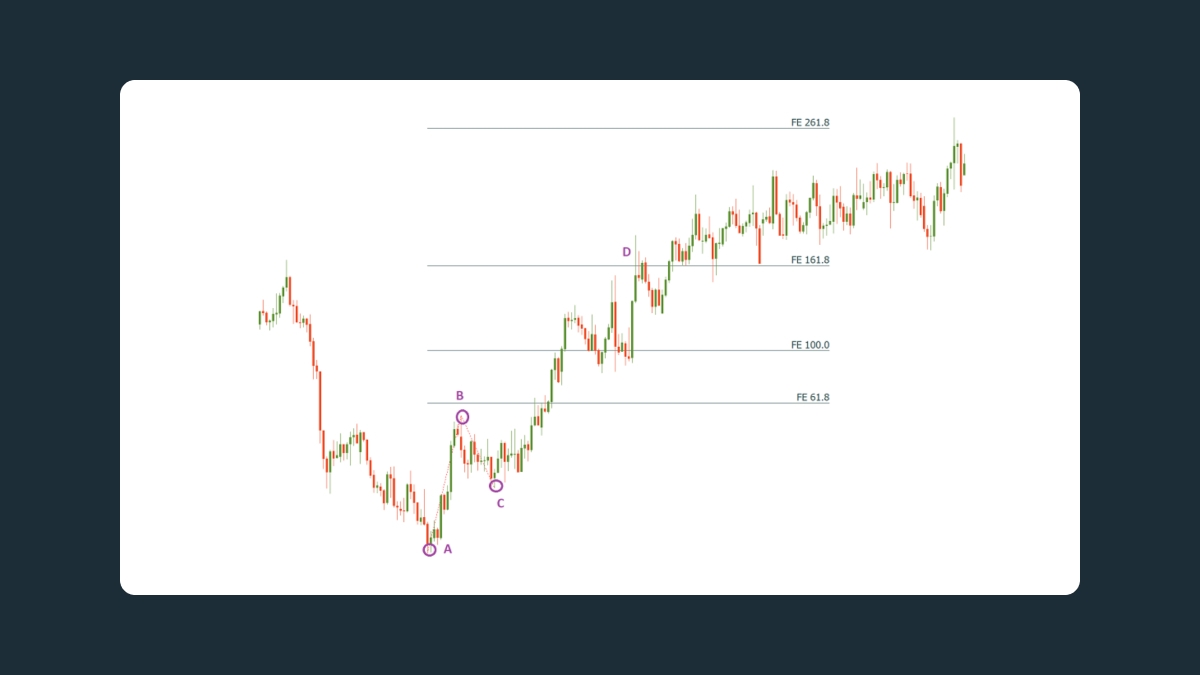
พูดง่าย ๆ ก็คือ คุณจะต้องมี 3 จุดบนกราฟเพื่อใช้เครื่องมือนี้ มองหาจุดเริ่มต้นของแนวโน้มใหม่: การเกิดจุดต่ำสุดที่สูงขึ้นหลังจากแนวโน้มขาลง (ใช้จุดต่ำแรก, จุดสูงสุดระหว่างกลาง และจุดต่ำสุดที่ต่ำลง เพื่อคาดการณ์การขยายตัวไปด้านบน) หรือจุดสูงสุดที่ต่ำลงหลังจากแนวโน้มขาขึ้น (ใช้จุดสูงแรก, จุดต่ำสุดระหว่างกลาง และจุดสูงสุดที่ต่ำลง เพื่อคาดการณ์การขยายตัวไปด้านล่าง)
เลือกเครื่องมือ Fibonacci Expansion ใน MetaTrader และลากเส้นเชื่อมระหว่าง 2 จุดแรก (จุด A และ B บนกราฟด้านล่าง) จากนั้นเลือกเครื่องมืออีกครั้งโดยคลิกที่เส้นฐานที่เห็นบนกราฟ แล้วลากขอบที่สามของเครื่องมือไปยังจุดสูงสุดหรือต่ำสุดที่สาม (จุด C) โดยไม่ปล่อยเมาส์ ปรับเส้นให้ทั้ง 3 จุดเชื่อมต่อกันอย่างถูกต้อง (ตรวจสอบว่าคุณได้วางเส้นไว้ที่ไส้เทียนหรือไม่)
วิธีการเทรดโดยใช้ Fibonacci expansion
มี 2 จุดที่เหมาะสำหรับการเข้าตลาด:
คุณสามารถเปิดตำสั่งซื้อขายได้ที่ระดับ Fibonacci retracement (38.2%, 50%, หรือ 61.8%) ของคลื่นแรก นั่นคือที่จุด C
คุณสามารถเปิดคำสั่งซื้อขายได้เมื่อราคาเคลื่อนที่เลยจุดสิ้นสุดของคลื่นแรก นั่นคือเหนือจุด B
จุด D คือตำแหน่งที่คุณกำหนดเป้าหมายทำกำไร โดยมันจะอยู่ที่ระดับการขยาย 161.8% หากแนวโน้มแข็งแกร่ง ราคาอาจเคลื่อนที่สูงขึ้นไปอีก ดังนั้นระดับการขยาย 261.8% ก็เป็นเป้าหมายที่น่าสนใจเช่นกัน