.jpg)
ทฤษฎีคลื่นเอลเลียต (Elliott Wave Theory) หรือบางครั้งเรียกว่าหลักการคลื่นเอลเลียต เป็นเครื่องมือที่ได้รับความนิยมและทรงพลังที่เทรดเดอร์และนักวิเคราะห์ใช้ในตลาดการเงินเพื่อทำนายการเคลื่อนไหวของราคาล่วงหน้า ราล์ฟ เนลสัน เอลเลียต พัฒนาแนวคิดนี้ขึ้นในช่วงทศวรรษ 1930 ทฤษฎีนี้อิงตามแนวคิดที่ว่าตลาดการเงินเป็นไปตามวัฏจักรของคลื่นที่ซ้ำ ๆ และสามารถคาดเดาได้ โดยมีแรงขับเคลื่อนจากจิตวิทยาร่วมของผู้เล่นในตลาด ที่น่าสนใจก็คือ ราล์ฟ เนลสัน ได้ศึกษากราฟรายชั่วโมงและกราฟราย 30 นาที สำหรับดัชนีต่าง ๆ ที่ครอบคลุมช่วงเวลาถึง 75 ปี
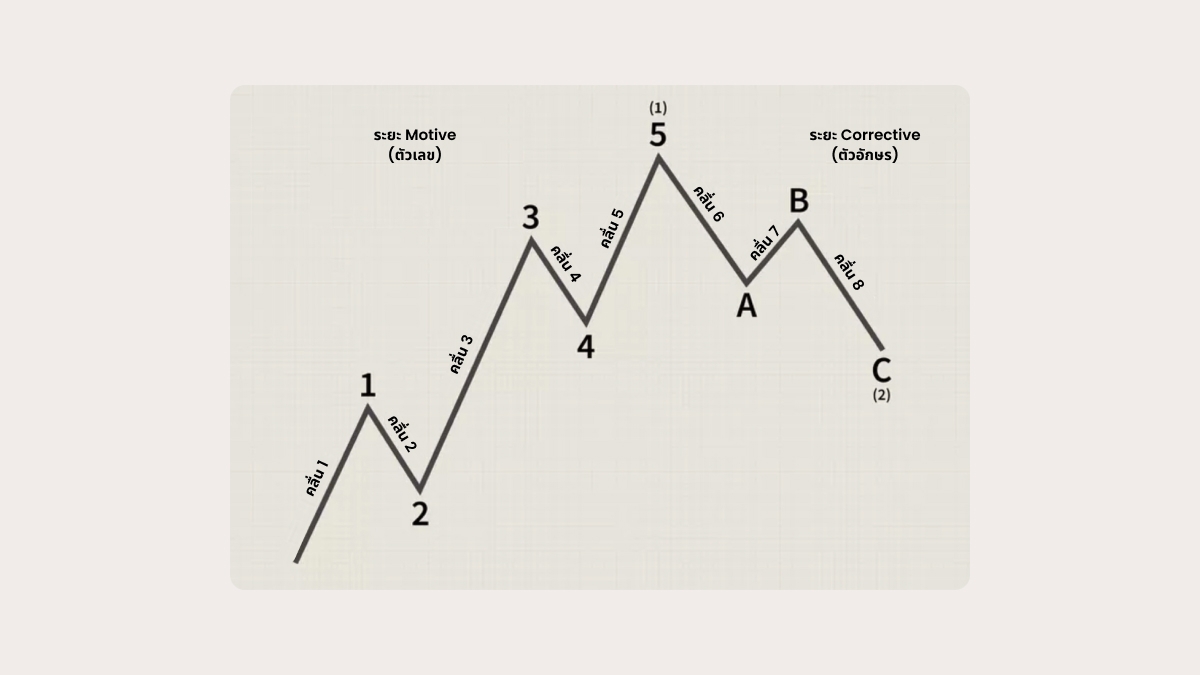
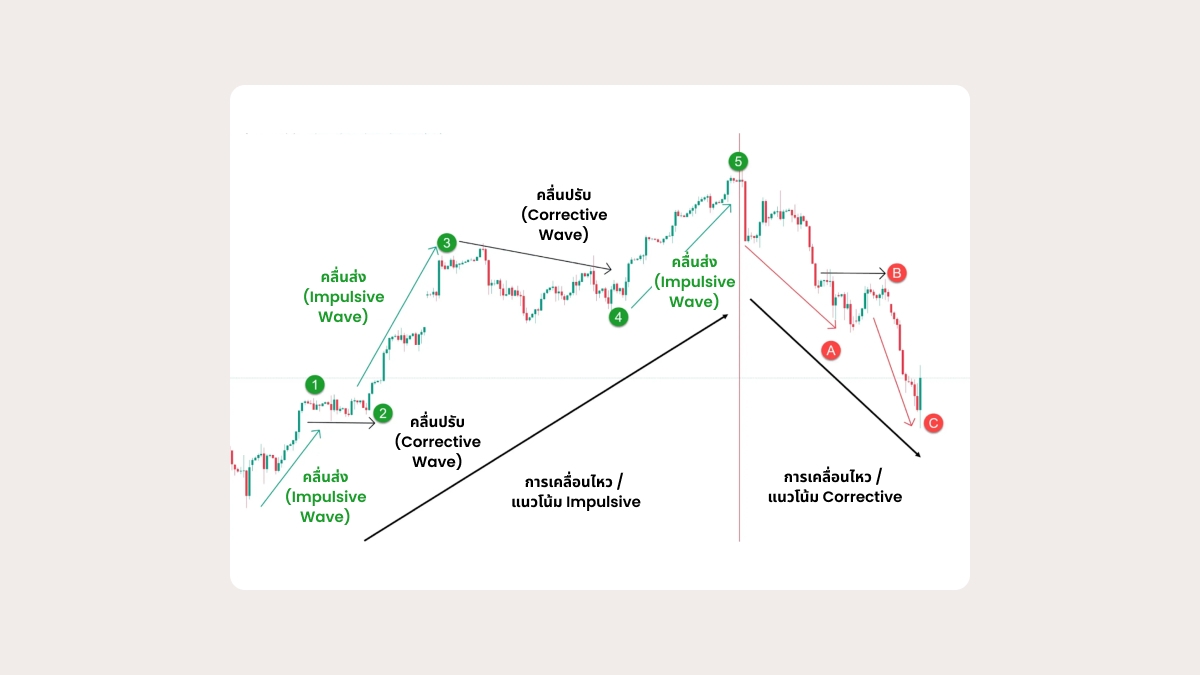
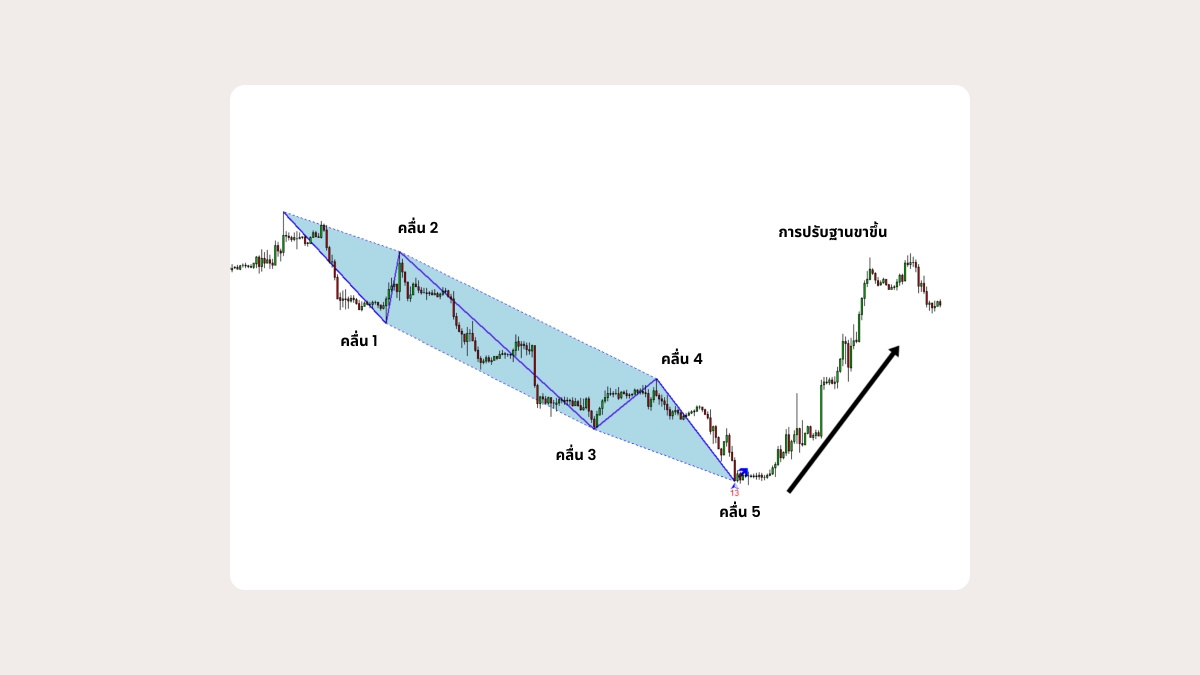
ตามทฤษฎีของเขา ตลาดจะเคลื่อนไหวเป็นชุดของคลื่นห้าคลื่นในทิศทางของแนวโน้มหลัก ตามด้วยคลื่น Corrective สามคลื่น คลื่นเหล่านี้มักทำซ้ำในรูปแบบแฟร็กทัล ซึ่งหมายความว่าคลื่นเกิดขึ้นในกรอบเวลาที่แตกต่างกันในหลายระดับ
หากคุณเข้าใจพื้นฐานของทฤษฎีคลื่นเอลเลียต คุณสามารถคาดการณ์แนวโน้มตลาดระบุจุดเข้าและจุดออกสำหรับการซื้อขายของคุณ และสร้างกลยุทธ์ตลาดที่มีประสิทธิภาพมากขึ้นได้
องค์ประกอบสำคัญของทฤษฎีคลื่นเอลเลียต
คลื่น Impulse (คลื่น Motive หรือคลื่นตามแนวโน้ม)
คลื่นทั้งห้าที่เคลื่อนที่ไปในทิศทางของแนวโน้มหลักเรียกว่า คลื่นส่ง ตั้งแต่คลื่น 1 ถึงคลื่น 5
การเคลื่อนไหวเริ่มต้นในทิศทางของแนวโน้มหลัก
คลื่น Corrective ที่มักจะย้อนกลับมาถึงบางส่วนของคลื่น 1 แต่จะไม่ย้อนกลับไปเกินจุดเริ่มต้นของคลื่น 1
คลื่นที่ยาวที่สุดและทรงพลังที่สุด เคลื่อนที่อย่างรุนแรงในทิศทางของแนวโน้ม
คลื่น Corrective โดยทั่วไปจะมีความรุนแรงน้อยกว่าคลื่นที่ 2 และไม่ทับซ้อนกับคลื่น 1
การเคลื่อนไหวสุดท้ายในคลื่นแนวโน้มบ่งชี้ถึงจุดสูงสุดหรือจุดที่หมดแรง
คลื่น Corrective (เคลื่อนที่สวนทางกับแนวโน้ม)
หลังจากคลื่น Impulse ห้าคลื่น ตลาดเข้าสู่ช่วงปรับฐาน ซึ่งแนวโน้มจะเปลี่ยนทิศทางชั่วคราว ขั้นตอนการปรับฐานนี้ประกอบด้วยสามคลื่น ได้แก่ A, B, และ C
A. การเคลื่อนไหวเริ่มต้นที่สวนทางกับแนวโน้มหลัก
B. คลื่น Corrective ที่ย้อนกลับส่วนหนึ่งของคลื่น A แต่ไม่เกินยอดสูงสุดของคลื่นนั้น
C. ช่วงสุดท้ายของระยะการปรับฐาน ซึ่งโดยทั่วไปมักจะทรงพลังที่สุด เคลื่อนไหวอย่างแรงในทิศทางตรงกันข้ามกับแนวโน้ม
กฎพื้นฐานของทฤษฎีคลื่นเอลเลียต
ทฤษฎีคลื่นเอลเลียตนำเสนอกฎหลักบางประการที่ตลาดปฏิบัติตามได้อย่างสะดวกสบาย กฎเหล่านี้ช่วยระบุโครงสร้างของคลื่น และเข้าใจความแตกต่างระหว่างคลื่น Impulse และคลื่น Corrective
เนื่องจากกฎอธิบายกลไกเฉพาะ จึงสามารถใช้เพื่อทําความเข้าใจทิศทางราคาในอนาคตอันใกล้และดําเนินการตามนั้น กฎสำคัญมีดังนี้
คลื่น 2 ไม่สามารถไปไกลกว่าจุดเริ่มต้นของคลื่น 1 ได้
คลื่น 3 จะไม่สั้นที่สุดเมื่อเทียบกับคลื่น 1, 3, และ 5
คลื่น 4 ไม่สามารถทับซ้อนกับอาณาเขตราคาของคลื่น 1 ได้
คลื่น 5 ควรจบลงด้วยไดเวอร์เจนซ์โมเมนตัม
ข้อดีและข้อเสียของทฤษฎีคลื่นเอลเลียต
ข้อดี:
พลังทำนาย
รูปแบบคลื่นมักจะทำนายการเคลื่อนไหวของตลาดได้อย่างน่าเชื่อถือธรรมชาติแบบแฟร็กทัล
ทฤษฎีนี้สามารถนำไปใช้กับกรอบเวลาใดก็ได้ เพื่อให้ได้ข้อมูลเชิงลึกในหลายระดับกรอบงานที่ครอบคลุม
ทฤษฎีนี้ผสมผสานการวิเคราะห์ทางเทคนิคเข้ากับจิตวิทยาตลาด
ข้อเสีย:
อัตวิสัย
การนับคลื่นอาจมีแนวโน้มที่จะเกิดข้อผิดพลาดของมนุษย์ และเทรดเดอร์อาจตีความคลื่นต่างกันความซับซ้อน
การเชี่ยวชาญทฤษฎีคลื่นเอลเลียตต้องใช้ทักษะทางการตลาด ประสบการณ์ และการฝึกฝนอย่างกว้างขวางอนาคตที่มืดมัว
น่าเสียดายที่ในขณะที่คลื่นเอลเลียตสังเกตได้ดีในช่วงเวลาที่ผ่านมาแต่ก็มีความทึบแสงมากขึ้นในอนาคตทำให้การใช้ทฤษฎีคลื่นเอลเลียตในทางปฏิบัติเป็นเรื่องยากและต้องการความรู้พิเศษ
วิธีใช้ทฤษฎีคลื่นเอลเลียตในการเทรด
ทฤษฎีใด ๆ จะเป็นที่รู้จักอย่างกว้างขวางและได้รับการยอมรับอย่างแท้จริงเมื่อถูกนำไปใช้ในวัตถุประสงค์เชิงปฏิบัติ เช่น การเทรด คุณจะใช้ทฤษฎีคลื่นเอลเลียตในกิจวัตรการเทรดของคุณได้อย่างไร?
ระบุแนวโน้มตลาด
ถ้าคุณสามารถระบุรูปแบบที่มีคลื่น Impulse ห้าคลื่นและคลื่น Corrective สามคลื่นได้ คุณจะสามารถกำหนดแนวโน้มตลาดที่เด่นชัดได้ ดังนั้น คุณจึงสามารถเข้าใจสภาวะตลาดได้ว่าเป็นแนวโน้มขาขึ้น แนวโน้มขาลง หรือไซด์เวย์สังเกตเห็นจุดเข้าและจุดออกของ
ทฤษฎีช่วยให้เทรดเดอร์เข้าสู่ตลาดในช่วงเวลาที่เหมาะสม:
- ที่จุดเริ่มต้นของคลื่น 3 (คลื่น Impulse ที่แรงที่สุด)
- ในช่วงคลื่น C (คลื่น Corrective ที่แรงที่สุด)
หากคุณต้องการวางแผนการออกของคุณให้พิจารณาจุดสิ้นสุดของคลื่น 5 และคลื่น C เมื่อตลาดคาดว่าจะกลับตัววิเคราะห์กรอบเวลา
คลื่นเอลเลียตเป็นภาพซ้ำ (แฟร็กทัล) กล่าวคือปรากฏในกรอบเวลาที่แตกต่างกัน เทรดเดอร์สามารถวิเคราะห์คลื่นในช่วงเวลาสั้น ๆ (เช่น บนกราฟ 5 นาทีหรือรายชั่วโมง) และระบุรูปแบบคลื่นเดียวกันบนกราฟระยะยาวกว่า (รายวันหรือรายสัปดาห์) ได้ นั่นหมายความว่าคุณสามารถเทรดตามความเคลื่อนไหวของตลาดในระยะสั้นกว่า และยังเข้าใจบริบทของแนวโน้มใหญ่กว่าได้ และตำแหน่งของคุณอาจแตกต่างกัน: คุณอาจมีมุมมองระยะยาวเป็นขาลงพร้อมกับตำแหน่งระยะสั้นเป็นขาขึ้นยืนยันกับตัวบ่งชี้อื่น ๆ
ทฤษฎีคลื่นเอลเลียตทำงานได้ดีที่สุดเมื่อรวมกับตัวบ่งชี้ทางเทคนิคอื่น ๆ เช่น ค่าเฉลี่ยเคลื่อนที่ออสซิลเลเตอร์ (RSI, MACD) และเส้นแนวโน้ม เครื่องมือเหล่านี้สามารถยืนยันการนับคลื่นและให้สัญญาณเพิ่มเติมสำหรับจุดเข้าและออก- จัดการความเสี่ยงของคุณ
เทรดเดอร์ทุกคนรู้ดีว่าการเคลื่อนไหวบางอย่างของตลาดก็เป็นไปไม่ได้ที่จะคาดเดา ดังนั้น การมีแผนกลยุทธ์สำหรับการบริหารความเสี่ยงจึงเป็นสิ่งสำคัญยิ่ง เมื่อคุณใช้ทฤษฎีคลื่นเอลเลียต คุณสามารถเปิดคำสั่ง Stop Loss ต่ำกว่าคลื่น 2 หรือสูงกว่าคลื่น 4 เพื่อลดการสูญเสียที่อาจเกิดขึ้น หากตลาดเคลื่อนไหวสวนทางกับคำสั่งซื้อขายของคุณ
การใช้ทฤษฎีคลื่นเอลเลียตใน MT5
นี่คือคำแนะนำทีละขั้นตอนเกี่ยวกับการใช้คลื่นเอลเลียตใน MetaTrader 5
เข้าสู่ระบบบัญชีการซื้อขายของคุณใน MT5
เลือกกราฟสำหรับตราสารที่คุณสนใจ
ในเมนูด้านบน คลิก Insert
วางเมาส์เหนือ Objects และเลือก Elliott
เลือกคลื่นที่คุณต้องการใช้กับกราฟ: Motive (impulse) หรือ Corrective
เลือกจุดบนกราฟที่คุณต้องการให้ปรากฏบนคลื่นของคุณ
สรุป
ทฤษฎีคลื่นเอลเลียตเป็นเครื่องมือวิเคราะห์ทางเทคนิคที่มีคุณค่าสำหรับเทรดเดอร์ที่ต้องการทำความเข้าใจและคาดการณ์การเคลื่อนไหวของตลาด เมื่อคุณเรียนรู้ที่จะระบุโครงสร้างแนวโน้มแบบห้าคลื่นและระยะการปรับฐานแบบสามคลื่นได้ คุณจะสามารถเข้าใจได้ว่าตลาดจะเดินหน้าไปทางไหนต่อไป
อย่างไรก็ตาม เพื่อที่จะสามารถนำทฤษฎีไปใช้ในการซื้อขายจริงในชีวิตประจำวันของคุณ คุณจะต้องมีประสบการณ์มากมายและความเข้าใจอย่างลึกซึ้งเกี่ยวกับพฤติกรรมของตลาด หากคุณเพิ่มเครื่องมือการวิเคราะห์ทางเทคนิคอื่นๆ ทฤษฎีคลื่นเอลลิออตจะช่วยเสริมความสามารถของคุณในการทำนายการเคลื่อนไหวของราคาและตัดสินใจอย่างมีข้อมูลมากขึ้น
คำถามที่พบบ่อย
ทฤษฎีคลื่นเอลเลียตต์ (Elliott Wave Theory) คืออะไร?
ทฤษฎีคลื่นเอลเลียตกำหนดว่าราคาในตลาดการเงินเคลื่อนไหวในชุดคลื่น Impulse ห้าคลื่นตามด้วยคลื่น Corrective สามคลื่น คลื่นเหล่านี้เกิดซ้ำในกรอบเวลาที่แตกต่างกันและสามารถใช้ทำนายทิศทางราคาสำหรับอนาคตได้
ทฤษฎีคลื่นเอลเลียตมีความน่าเชื่อถือแค่ไหนในการเทรด?
หากคุณเข้าใจทฤษฎีคลื่นเอลเลียต คุณจะสามารถมองเห็นแนวโน้มสำหรับตราสารที่คุณสนใจ เข้าและออกจากตลาดในจุดที่เหมาะสม และปรับปรุงผลลัพธ์การเทรดของคุณได้
อย่างไรก็ตาม คุณจำเป็นต้องสะสมประสบการณ์ในตลาดอย่างมากและขัดเกลาทักษะการซื้อขายของคุณเพื่อที่จะสามารถนำทฤษฎีไปใช้ในทางปฏิบัติได้จริง นอกจากนี้คลื่นเอลเลียตยังสามารถมองเห็นได้ดีขึ้นในช่วงเวลาที่ผ่านมา ในขณะที่มันอาจจะจางหายไปในอนาคต ซึ่งหมายความว่าคุณจะต้องรวมคลื่นเอลเลียตกับตัวบ่งชี้ทางเทคนิคอื่น ๆ เพื่อเพิ่มความน่าเชื่อถือของการคาดการณ์
ข้อดีของทฤษฎีคลื่นเอลเลียตคืออะไร?
คลื่นเอลเลียตมีความคุ้มค่าในการทำนายการเคลื่อนไหวของตลาดด้วยความน่าเชื่อถือสูงเมื่อคุณรู้วิธีที่จะระบุพวกมันได้ เนื่องจากทฤษฎีนี้ใช้ได้กับกรอบเวลาที่หลากหลาย คุณจึงสามารถใช้ได้ทั้งในช่วงเวลาสั้นและระยะยาว การผสมผสานระหว่างการวิเคราะห์ทางเทคนิคกับจิตวิทยาของเทรดเดอร์ทำให้ทฤษฎีนี้เป็นเครื่องมือที่หลากหลายซึ่งจะทำงานได้ในหลายสถานการณ์ อย่างไรก็ตาม โดยปกติแล้วจะมีเพียงเทรดเดอร์ที่มีประสบการณ์เท่านั้นที่สามารถใช้ทฤษฎีคลื่นเอลเลียตได้อย่างมีประสิทธิภาพตามที่ต้องการ ดังนั้นคุณอาจต้องลงทุนเวลามากพอสมควรในการศึกษาให้เชี่ยวชาญ