.jpg)
How to use Fibonacci expansion?
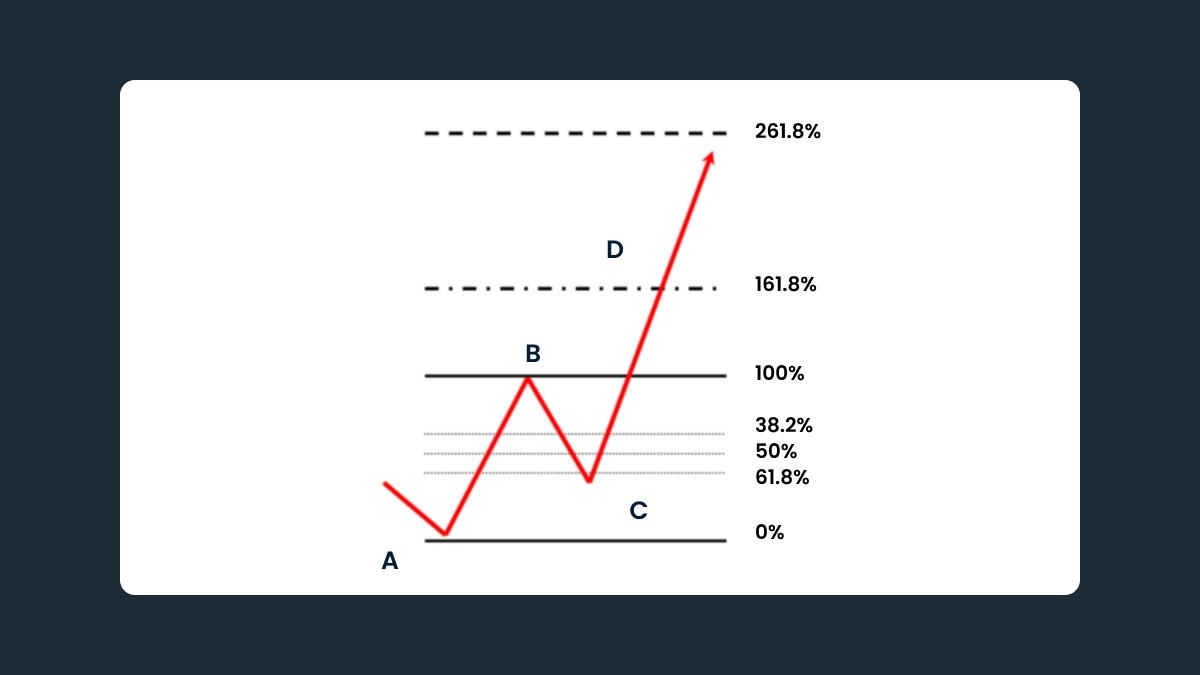
While plotting the Fibonacci expansion, you have to take 2 price waves into account.
The first wave (AB) represents the price movement in line with the main trend. The distance between points A and B is seen as 100% and used in further calculations.
The second wave (BC) is a correction of the price’s previous movement. Its end at point C, which is the starting point from which the expansion levels are plotted in line with Fibonacci coefficients 0.618 (61.8%), or 1.618 (161.8%). There are also optional expansions at 2.618 and 4.236.
The Fibonacci expansion tool is used to find the location of the third wave (check out Elliott wave theory).
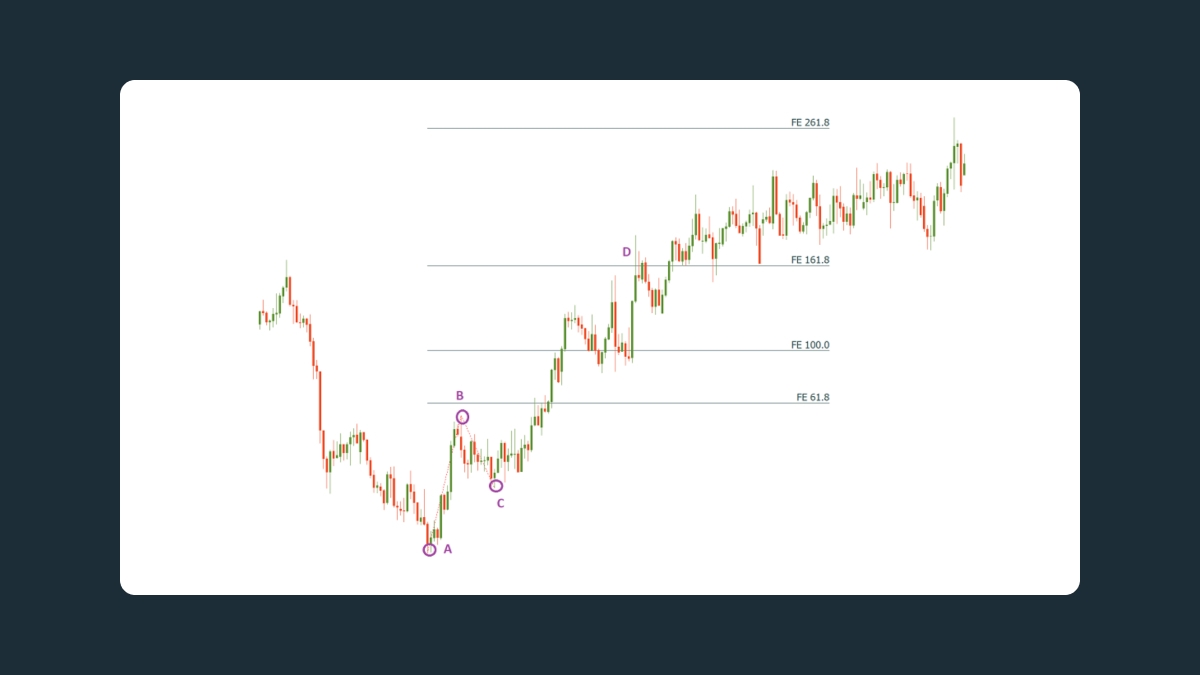
To put it simply, you will need 3 points on the chart to apply the tool. Look for the start of a new trend: formation of a higher low after a downtrend (the first low, the interim high and the lower low will be used to project the expansions to the upside), or a lower high after an uptrend (the first high, the interim low and the lower high will be used to project the expansions to the downside).
Choose the Fibonacci expansion tool in MetaTrader and connect the first 2 points with a line (points A and B on the chart below). Then select the instrument once again by clicking on the baseline you see on the chart and drag the third edge of the instrument to the third top or bottom (point C) without releasing the mouse. Adjust the line so that all 3 points are connected correctly (check that you placed the lines at candlesticks’ wicks).
How to trade using the Fibonacci expansion
There are 2 places to enter the market:
You can enter the trade on the basis of the Fibonacci retracement level (38.2%, 50%, or 61.8%) of the first wave, i.e. at point C.
You can enter when the price moves beyond the end of the first wave, i.e. above point B.
Point D is where you put your take-profit level. It’s located at the 161.8% expansion. If the trend is strong, the price may move further to the upside, so the 261.8% expansion is also a potential target.